The PRISMA flow diagram is one of the most recognisable elements of a systematic literature review. It provides a transparent, visual summary of how studies were identified, screened, and selected for inclusion. For examiners and reviewers, the diagram is often the first place they look to assess the rigour and credibility of a systematic review.
Despite its widespread use, many students misunderstand what the PRISMA flow diagram represents or how to report it correctly. Common errors include inconsistent numbers, missing exclusion reasons, or using the diagram without actually following a systematic process. These mistakes can significantly weaken the methodological credibility of a review.
This article explains the PRISMA flow diagram step by step. It clarifies what each stage represents, how the numbers should be calculated, and how students can use the diagram to demonstrate transparency and academic rigour in systematic reviews.
What the PRISMA Flow Diagram Is and Why It Matters
The PRISMA flow diagram is part of the Preferred Reporting Items for Systematic Reviews and Meta-Analyses framework. Its purpose is to document the journey from an initial pool of identified records to the final set of included studies.
Rather than presenting findings, the diagram reports process. It shows how many records were found, how many were removed, and why certain studies were excluded. This transparency allows readers to evaluate potential bias and assess whether the review process was systematic.
The PRISMA flow diagram reports how studies were selected, not what they concluded.
Because of this, the diagram is a methodological accountability tool rather than a results summary.
How the PRISMA Flow Diagram Fits into a Systematic Review
The PRISMA flow diagram complements the written methodology section of a systematic review. While the text explains how the review was conducted, the diagram provides a concise visual summary of the selection process.
In dissertations and postgraduate research, the diagram is usually presented in the methodology or results section. It supports claims of systematic searching and structured screening.
Importantly, the diagram does not replace methodological explanation. Instead, it reinforces it.
The Four Main Stages of the PRISMA Flow Diagram
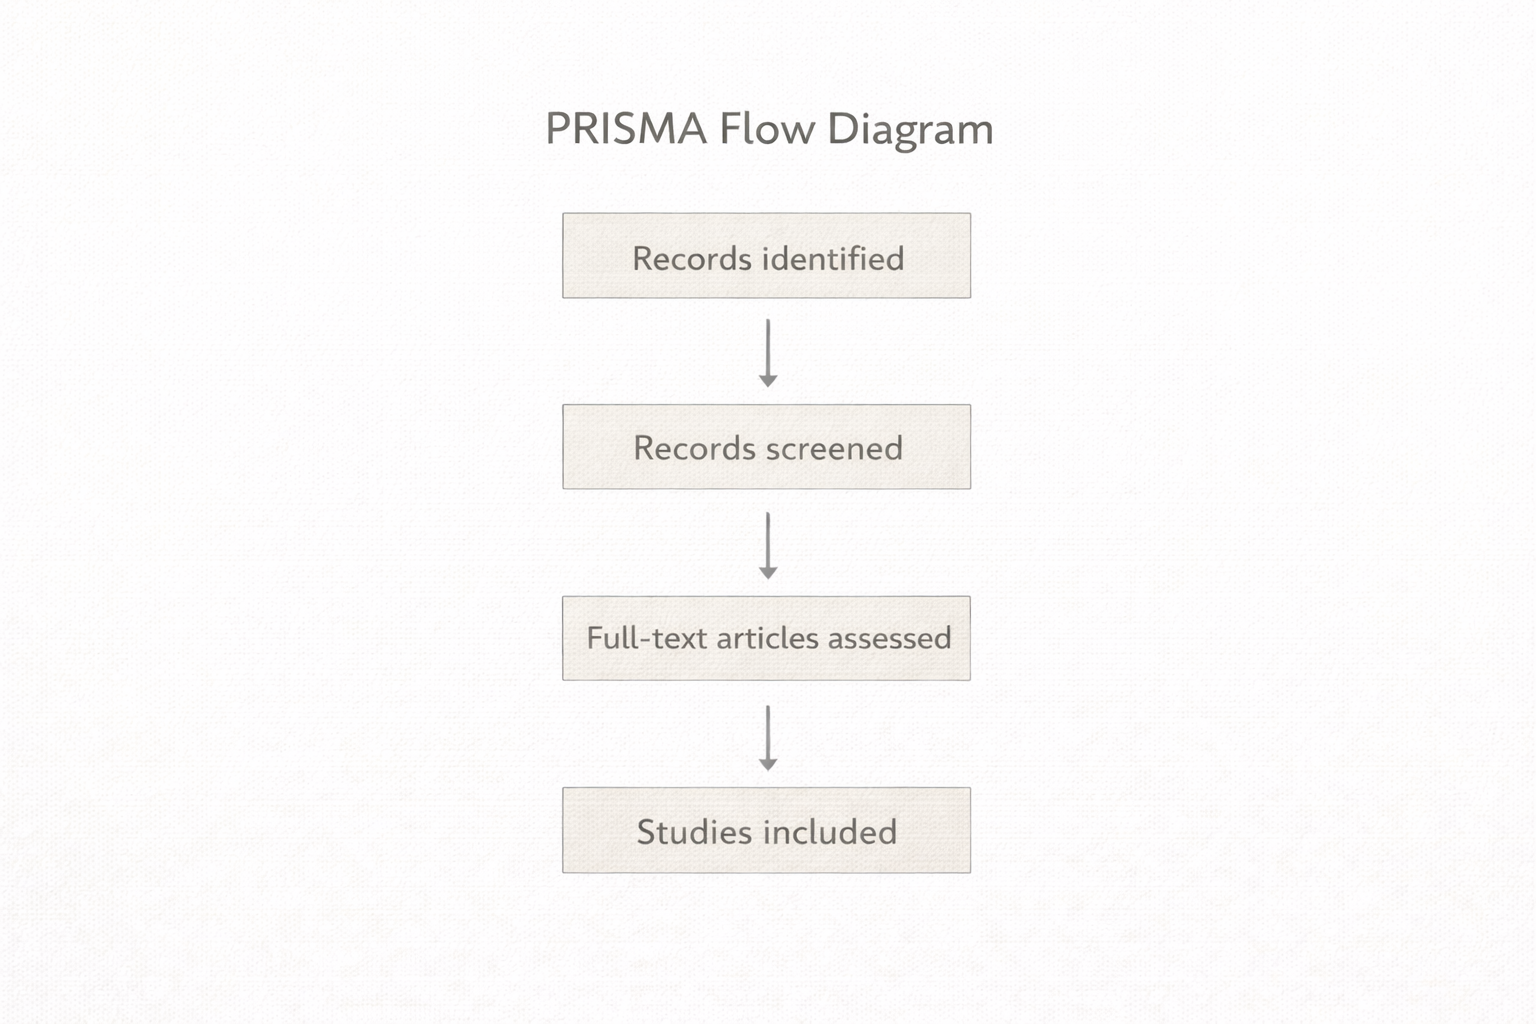
The PRISMA flow diagram is organised into four core stages: identification, screening, eligibility, and inclusion. Each stage corresponds to a specific phase of the review process.
Understanding what each stage represents is essential for accurate reporting and interpretation.
Identification Stage Explained
The identification stage documents how many records were initially found through database searches and other sources. This stage reflects the breadth of the search strategy.
Records may be identified through academic databases, manual searching, reference lists, or grey literature. Duplicate records are usually identified and removed at this stage.
Accurate reporting here demonstrates that the search was comprehensive rather than selective.
Screening Stage Explained
The screening stage shows how many records remained after duplicates were removed and how many were excluded based on titles and abstracts.
At this stage, studies are excluded because they are clearly irrelevant to the research question. Reasons for exclusion are not usually detailed individually, but the total number excluded must be reported.
Title and abstract screening must follow predefined inclusion criteria.
Consistency between screening criteria and earlier protocol decisions is essential.
Eligibility Stage Explained
The eligibility stage reports how many full-text articles were assessed and how many were excluded after detailed evaluation.
Unlike screening, exclusions at this stage must be justified with clear reasons, such as wrong population, inappropriate methodology, or insufficient data.
This stage is critical for demonstrating critical judgement and methodological transparency.
Inclusion Stage Explained
The inclusion stage shows the final number of studies included in the systematic review. These are the studies that meet all eligibility criteria.
This number forms the evidence base for synthesis and analysis. Any discrepancy between included studies and later analysis raises serious methodological concerns.
Clear alignment between the diagram and the written synthesis is therefore essential.
Interpreting Numbers in a PRISMA Flow Diagram
Every number in a PRISMA flow diagram must add up logically. Examiners often check whether numbers flow consistently from one stage to the next.
For example, the number of records screened should equal the number identified minus duplicates. Similarly, the number assessed for eligibility should match the number that passed screening.
Inconsistencies signal poor record-keeping or misunderstanding of the process.
Example Structure of PRISMA Flow Diagram Data
The table below illustrates how numerical data typically align with each PRISMA stage.
| PRISMA Stage | What Is Reported | Academic Purpose |
|---|---|---|
| Identification | Total records found and duplicates removed | Demonstrate search breadth |
| Screening | Records screened and excluded | Show relevance filtering |
| Eligibility | Full-text articles assessed and excluded with reasons | Demonstrate critical appraisal |
| Inclusion | Final studies included | Define evidence base |
This alignment ensures methodological clarity.
Common Mistakes Students Make with PRISMA Flow Diagrams
One common mistake is creating a PRISMA diagram without conducting a truly systematic search. The diagram must reflect actual processes, not idealised ones.
Another frequent error is reporting numbers inconsistently between the diagram and the text. This raises questions about data integrity.
Students also sometimes omit reasons for exclusion at the eligibility stage, which undermines transparency.
PRISMA Flow Diagram vs Narrative Review Reporting
The PRISMA flow diagram is designed specifically for systematic reviews. It is not required for narrative or traditional literature reviews.
Using a PRISMA diagram in a narrative review can confuse examiners and suggest misunderstanding of review types.
Students should only use PRISMA when their methodology genuinely follows a systematic approach.
How Examiners Use the PRISMA Flow Diagram
Examiners use the PRISMA flow diagram to verify methodological claims quickly. It allows them to assess search comprehensiveness, screening rigour, and exclusion logic at a glance.
A clear, consistent diagram strengthens examiner confidence. Conversely, a poorly constructed diagram invites closer scrutiny of the entire methodology.
The PRISMA flow diagram often determines first impressions of methodological quality.
This makes accuracy and clarity essential.
Using the PRISMA Flow Diagram in Student Research
At undergraduate level, PRISMA diagrams may be simplified but should still reflect genuine systematic steps. Transparency matters more than scale.
At postgraduate level, full PRISMA compliance is often expected, especially in dissertations and theses.
Students should always confirm expectations with their assignment brief or supervisor.
Documenting Decisions to Support the PRISMA Diagram
A PRISMA flow diagram must be supported by clear documentation. Keeping records of search results, screening decisions, and exclusion reasons is essential.
Without proper documentation, reconstructing accurate numbers later becomes difficult and error-prone.
Good documentation practices protect academic credibility and save time.
How the PRISMA Flow Diagram Supports Research Integrity
The PRISMA flow diagram promotes research integrity by making selection decisions visible. It discourages selective reporting and encourages accountability.
This transparency is particularly important in evidence-based disciplines, where conclusions may inform practice or policy.
Even in student research, these principles apply.
Applying the PRISMA Flow Diagram with Academic Confidence
Understanding the PRISMA flow diagram is essential for conducting and reporting systematic reviews correctly. Each stage represents a deliberate methodological decision.
By ensuring numerical consistency, clear exclusion reasoning, and alignment with written methods, students can use the PRISMA diagram to strengthen their research credibility.
When applied properly, the PRISMA flow diagram transforms complex review processes into clear, defensible academic evidence.

Comments