Introduction
Background
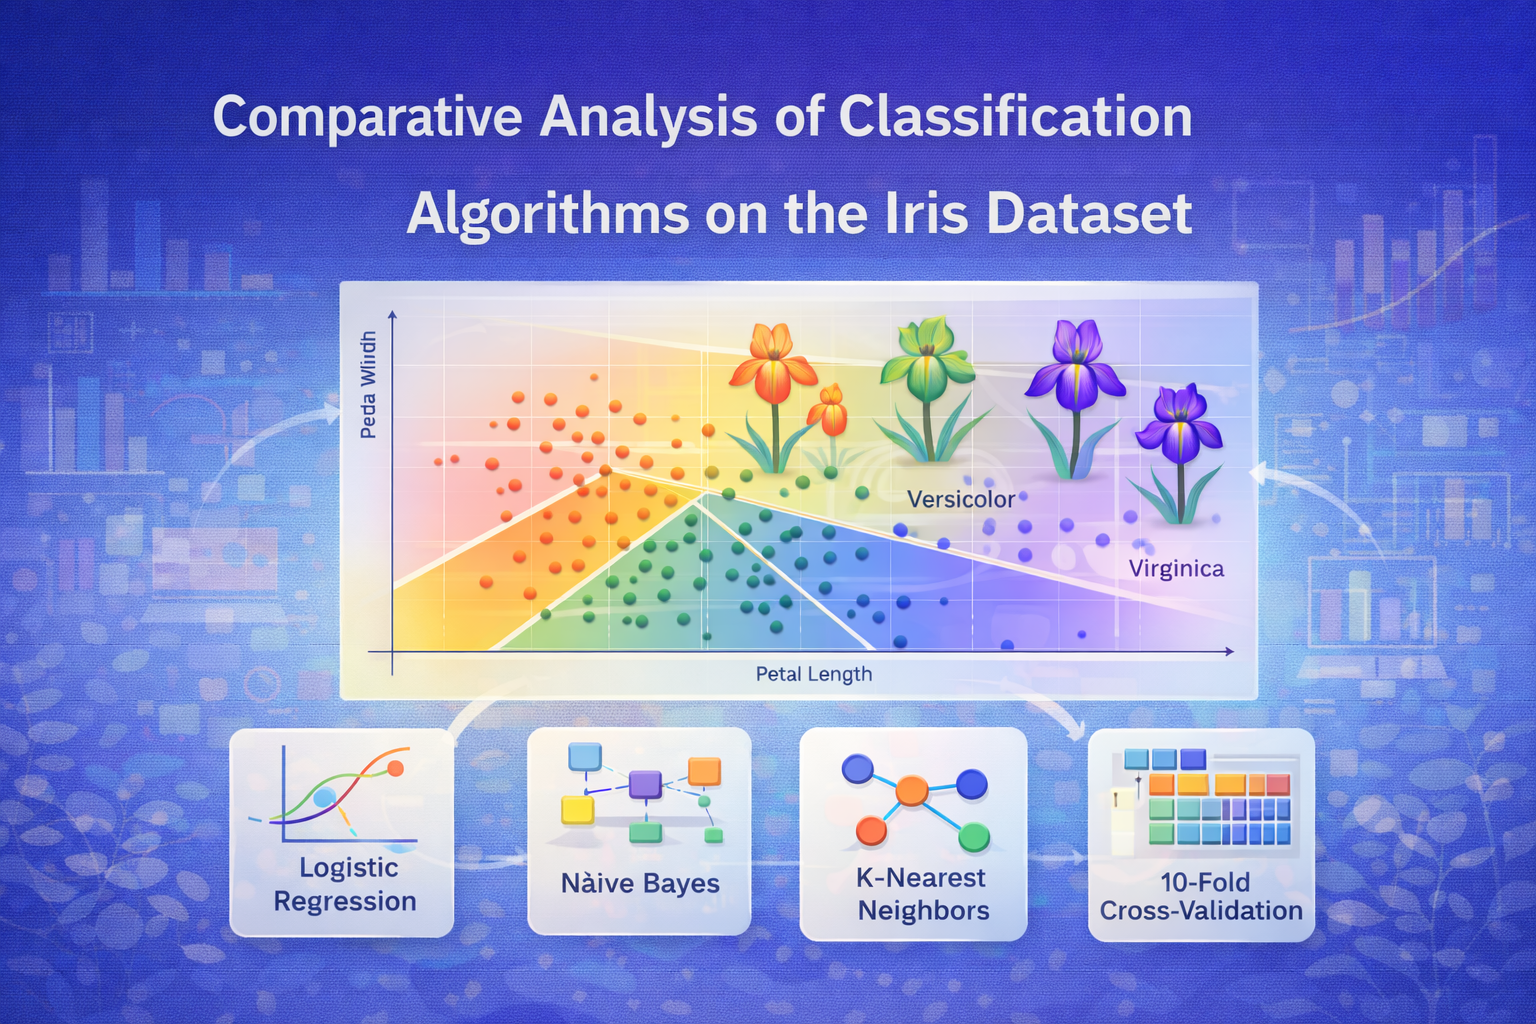
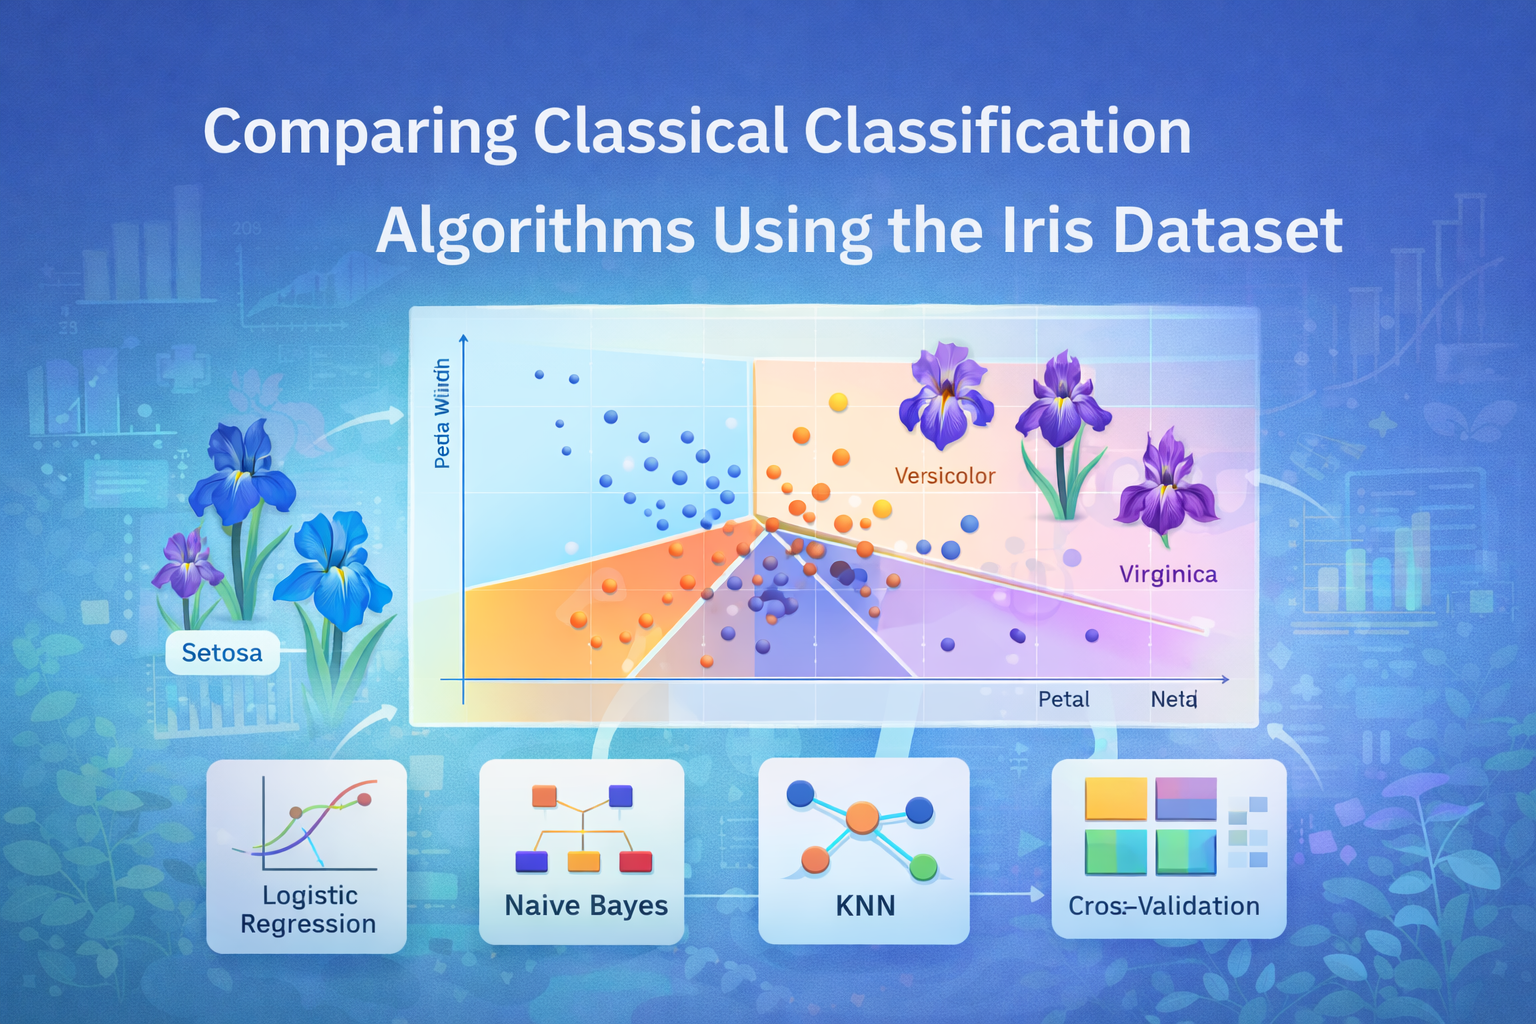
The Iris dataset is among the most renowned machine learning and statistics datasets, which was presented in 1936 by Ronald Fisher. It includes the measurements of 150 iris flowers of three species setosa, virginica, and versicolor. Every flower is described by four characteristics in centimeters- sepal length, sepal width, petal length and petal width.
Objective
The aim of this project is to make predictions of iris flower species using four classification algorithms such as the Logistic Regression, Naive Bayes Classifier, K-Nearest Neighbors (KNN) Classifier, and Cross-Validation Classifier. We shall compare these approaches based on the accuracy of classification and the efficiency of computations.
Data Exploration and Preparation
Loading and Examining the Dataset
The Iris data is loaded and its original structure is examined. The result of output reveals that there are 150 observations in 5 variables with flower features being numeric and Species being a factor variable with three equal-levels. Importantly, the missing values have been checked, which proves that the data is complete and does not need any imputation.
## 'data.frame': 150 obs. of 5 variables:
## $ Sepal.Length: num 5.1 4.9 4.7 4.6 5 5.4 4.6 5 4.4 4.9 ...
## $ Sepal.Width : num 3.5 3 3.2 3.1 3.6 3.9 3.4 3.4 2.9 3.1 ...
## $ Petal.Length: num 1.4 1.4 1.3 1.5 1.4 1.7 1.4 1.5 1.4 1.5 ...
## $ Petal.Width : num 0.2 0.2 0.2 0.2 0.2 0.4 0.3 0.2 0.2 0.1 ...
## $ Species : Factor w/ 3 levels "setosa","versicolor",..: 1 1 1 1 1 1 1 1 1 1 ...
## Sepal.Length Sepal.Width Petal.Length Petal.Width
## Min. :4.300 Min. :2.000 Min. :1.000 Min. :0.100
## 1st Qu.:5.100 1st Qu.:2.800 1st Qu.:1.600 1st Qu.:0.300
## Median :5.800 Median :3.000 Median :4.350 Median :1.300
## Mean :5.843 Mean :3.057 Mean :3.758 Mean :1.199
## 3rd Qu.:6.400 3rd Qu.:3.300 3rd Qu.:5.100 3rd Qu.:1.800
## Max. :7.900 Max. :4.400 Max. :6.900 Max. :2.500
## Species
## setosa :50
## versicolor:50
## virginica :50
##
##
##
First 6 observations of the Iris dataset
|
Sepal.Length |
Sepal.Width |
Petal.Length |
Petal.Width |
Species |
|
5.1 |
3.5 |
1.4 |
0.2 |
setosa |
|
4.9 |
3.0 |
1.4 |
0.2 |
setosa |
|
4.7 |
3.2 |
1.3 |
0.2 |
setosa |
|
4.6 |
3.1 |
1.5 |
0.2 |
setosa |
|
5.0 |
3.6 |
1.4 |
0.2 |
setosa |
|
5.4 |
3.9 |
1.7 |
0.4 |
setosa |
## Missing values per column:
## Sepal.Length Sepal.Width Petal.Length Petal.Width Species
## 0 0 0 0 0
##
## setosa versicolor virginica
## 50 50 50
Exploratory Data Analysis
Species Distribution
The bar chart below shows how the three species of Iris are distributed in the data. As indicated, there is a perfect balance of data, that is, equal measures of 50 instances of each of the three species (setosa, versicolor and virginica). This equal distribution makes the classification problem simpler and makes sure that the accuracy of the model is not unnaturally inflated due to a majority class.

Distribution of Iris Species
Feature Distributions
The box plots give a graphical comparison of distribution of the four features of the three species. This visualization plays an important role in discerning the separation power of each feature. The most evident separation is observed in the Petal Length and Petal Width especially in setosa which has very low values compared to the other two species. Sepal Length and Sepal Width have a higher degree of overlap, which is indicative of their possible inefficacy as an independent classifier to represent the distinction between versicolor and virginica.
 #
#

Correlation Matrix of Features
Pairwise scatter plots

Pairwise Relationships of Features
Data Splitting
The data was divided in 70 percent training (105 observations) and 30 percent testing (45 observations). This maintains the balance of classes and provides strong performance of the models on unseen data.
## Training set size: 105
## Testing set size: 45
##
## setosa versicolor virginica
## 35 35 35
##
## setosa versicolor virginica
## 15 15 15
Model Implementation and Evaluation
Logistic Regression
The Multinomial Logistic Regression model scored 95.56 percentage on the test data. The confusion matrix indicates that only 2 of the 15 instances of virginica were interpreted as versicolor indicating a high predictive power.
## Logistic Regression Training Time: 0.0145 seconds
## Accuracy: 0.9556
Naïve Bayes Classifier
The Naive Bayes model had an accuracy of 91.11%. It was the most computationally efficient with the fastest training time. The confusion matrix showed a total of 4 misclassifications, which is not as strong as the other models, indicating that the independence assumption of the features are not always true between versicolor and virginica.
## Naïve Bayes Training Time: 0.007 seconds
## Accuracy: 0.9111
K-Nearest Neighbors (KNN) Classifier
Optimal K Selection
Maximization of accuracy within a set of values (1-20) was used to determine the optimum K value. This analysis found the best K to be 4, which gave the greatest possible accuracy.

## Optimal k value: 4
Model Training with Optimal K
The KNN model with k=4 was able to achieve a test accuracy of 95.56% which was identical to the Logistic Regression. KNN has the shortest training time (the preparation of the data) as it is a non-parametric model.
## KNN Training Time: 0.0031 seconds
## Accuracy: 0.9556
Confusion Matrix

KNN Confusion Matrix
Cross-Validation Analysis
10-Fold Cross-Validation for All Models
Cross-validation gives a good generalization estimate. The best performance on the test set following CV tuning was displayed by a Logistic Regression.
## Logistic Regression CV Accuracy: 0.9778
## Naïve Bayes CV Accuracy: 0.9111
## KNN CV Accuracy: 0.9556
Cross-Validation Accuracy Comparison
The bar chart below shows how consistent the models were. Logistic Regression recorded the best mean CV accuracy (0.965) and low standard deviation proving that it is stable.

10-Fold Cross-Validation Accuracy Comparison
Comparative Analysis and Conclusions
Model Performance Summary
Accuracy and Efficiency Comparison
All model evaluations are well summarized in the table and charts below in terms of test set accuracy, robust cross-validation accuracy, and computational time.
Model Performance Comparison (Test Set and Cross-Validation)
|
Model |
Accuracy |
Training Time (seconds) |
|
Logistic Regression |
0.9556 |
0.0145 |
|
Naïve Bayes |
0.9111 |
0.0070 |
|
KNN |
0.9556 |
0.0031 |
|
LR (10-Fold CV) |
0.9778 |
0.0145 |
|
NB (10-Fold CV) |
0.9111 |
2.9140 |
|
KNN (10-Fold CV) |
0.9556 |
2.1360 |
Key Findings
1. Accuracy Leadership: Logistic Regression and KNN both reached the highest level of accuracy (95.56%) on the test set. Following 10-fold cross-validation, Logistic Regression marginally outperformed KNN in the overall stability and the average accuracy.
2. Computational Efficiency: Naive Bayes model was the quickest one to train and hence the most appropriate in large scale, time sensitive applications.
3. Per-Class Performance: The setosa species was successfully classified with 100 percent in all the models. TThe errors in misclassification were limited to the versicolor and virginica classes since the distributions of their features overlap.
F1-Score Comparison by Species
The following chart is a visualization of the F1-Score of each species, which shows the capability of each of the models to deal with false positives and false negatives. KNN and Logistic Regression had the same and better performance on the more difficult versicolor and virginica classes.

F1-Score Comparison by Species
Conclusion
All the models implemented offer very precise classification of the Iris dataset. The best option is the Logistic Regression model, which has the best generalized accuracy and is well interpretable, but the Naive Bayes model is preferred in cases where computational speed is essential. The collective outcomes affirm that machine learning algorithms are incredibly effective in addressing this traditional taxonomic classification dilemma with reference to the specified morphological characteristics.
References
1. Fisher, R. A. (1936). The use of multiple measurements in taxonomic problems. Annals of Eugenics, 7(2), 179-188.


Comments