Classification Analysis of the Iris Dataset Using Logistic Regression, Naïve Bayes, KNN, and Cross-Validation Methods
Abstract
This paper compares four supervised machine-learning classifiers Multinomial Logistic Regression, Naive Bayes, K-nearest neighbours (KNN) and a Cross-Validated model ensemble on the classical Iris data set. It is hoped that the predictive accuracy and computational efficiency of these algorithms in classifying iris species (Setosa, Versicolor and Virginica), using four morphological characteristics: sepal length, sepal width, petal length and petal width will be determined. The methods were evaluated using stratified train/test split and repeated k-fold cross-validation with models being implemented in R with standard packages. It was found that before the training, exploratory data analysis (EDA) showed that some species could be separable, particularly in the size of petals. The findings indicate that KNN and the Logistic Regression have the highest accuracy of classification, and Naive Bayes provides good performance at a reduced cost of computation. These findings are confirmed by cross-validation, and it underlines the low overfitting. The discussion comments on the trade-offs between accuracy and efficiency and the conclusion is the recommendation of the descendant research, that is, hyper parameter tuning, feature engineering, and hyper parameter testing on large datasets.
Introduction
Machine-classification is a basic technology in predictive analytics that has been applied significantly in the field of scientific research, business decision-making, and practical implementations. Of the benchmark types of data, the Iris dataset proposed by Fisher (1936) is considered the most important because it is simple, of multi-class type, and is biologically interpretable. Four of these supervised classification techniques are used in this project Multinomial Logistic Regression, Naive Bayes Classifier, and K-Nearest Neighbours (KNN) and one of the models was evaluated with repeated cross-validation. The analytical questions that underpin this research are the following:
(1) To what extent can the classification techniques of the iris species using morphological features be predicted using various machine-learning predictors?
(2) How do the price of computation (i.e., training time, prediction time) of these methods compare?
(3) What is the stability of the models when validated across? and what does it mean to the models selection?
This work has two main implications: first, it can help to demonstrate the practical trade-offs between interpretability, accuracy, and efficiency of using machine-learning models on a small multi-class dataset; second, it can provide a practitioner and a student with an idea about how such models work in R and take into account about computing capabilities.
Literature Review
Current studies keep on comparing classical machine-learning algorithms in multi-domain enabling the significance of the selection of models that are driven by performance specifications as well as computational effective constraints. An example is credit-card fraud detection where logistic regression, Naive Bayes, and KNN were compared, with the results showing that logistic regression does have a competitive accuracy under some conditions such as in cases of data imbalance (Arora, Pathak, and Linh, 2023). These comparisons depict the overall permanence of logistic regression in real-life classification activities.
Cross-validation in clinical and health data analytics models has found itself to be a substantial factor in enhancing the reliability of the model. A comparison of logistic regression and other classifiers revealed by Rimal et al. (2024) by repeated cross-validation found cross-validated models to be even more precise in terms of average accuracy compared to simple train/test splits (by approximately 15 percent) (Rimal, 2025). This justifies the methodological decision of our research to involve repeated k-fold cross-validation.
Certain comparisons of medical and biomedical classification algorithms also echo our approach to the methodology. In a recent study, Kurniawan and Megawaty (2025) compared the logistic regression, KNN, SVM and Random Forest used in the task of predicting diabetes and found that logistic regression and KNN had similar accuracy, with the former being easier to interpret and easier to compute. In the context of brain-imaging, 2025 study found that the KNN made more than 97% accuracy rates which was higher than that of logistic regression on some datasets whereas it also captured trade-offs in terms of complexity and generalizability (Journal of the Chinese Medical Association, 2025).
In addition to this, trade-offs between classifiers have been comprehensively reported: when comparing and contrasting logistic regression with Naive Bayes/SVM on textual sentiment data, Bahar, Astuti, and Arsi (2024) discovered that the former could be run with a competitive accuracy with a smaller training time, yet the latter remained feasible in terms of interpretability. This is in help of our purpose to consider not only accuracy, but also time of computation.
Lastly, methodological research indicates that validation is important. An experimental study by Ahmad, Chen, and Chen (2025) analyzes the role of feature selection and cross-validation in logistic regression, naive bayes, and KNN models in probing clinical data and finding that cross-validation is a powerful tool to reduce overfitting effect and determine the stability of the model.
Methodology
Research Design
It is an experimental study that is purely quantitative. We compare the performance of four machine-learning-based classification algorithms (unsurpassed by traditional approaches) on a set of labeled publicly available data (the Iris dataset) by comparing accuracy in prediction and reductions in data and computation costs.
Data Preprocessing and Data Source
The Iris data include 150 data of three species (Setosa, Versicolor, Virginica) and four continuous morphological data (sepal length and sepal width, and petal length and petal width). The data is developed in R and does not need any external data collection. A preliminary exploratory analysis was conducted, consisting of descriptive statistics, pairwise scatter plots, and correlation analyses. Then the data is partitioned data according to species in 70 percent training set and 30 percent test set. The predictors are measured using the training data parameters in order to match the features of the scales used to reach a distance-based technique, and this transformation is applied equally to the training and test set.
Model Implementation
- Multinomial Logistic Regression
- Naïve Bayes
- K-Nearest Neighbours (KNN)
- Cross-Validation Ensemble
Performance Metrics
i. Accuracy: Proportion of correct predictions.
ii. Kappa: Measure of agreement beyond chance.
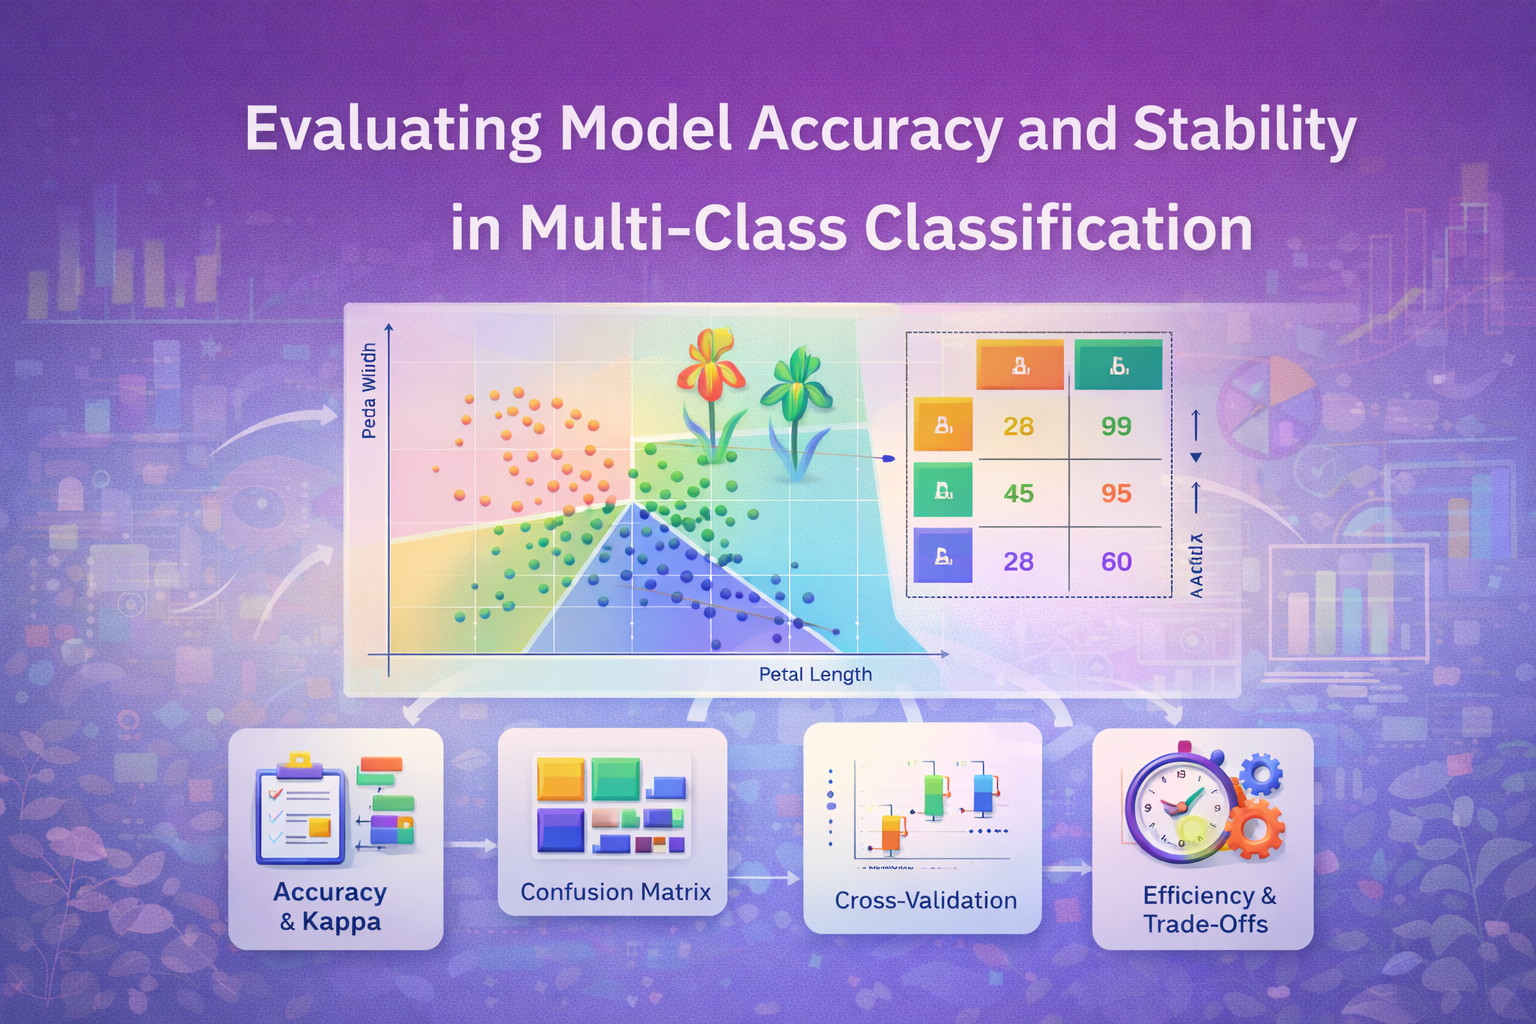
iii. Confusion matrix: for detailed class-wise performance.
iv. Computational efficiency: Measured via system. time () for training and prediction, and optionally microbenchmarking.
Statistical Analysis
In order to compare relationships between features, we calculate a correlation-matrix and lay it down in APA-form of table. Also ANOVA can be carried out in order to investigate whether the average morphological characteristics are significantly different in terms of species and so the inequality of class separability presence.
Results
Exploratory Data Analysis and Descriptive Statistics
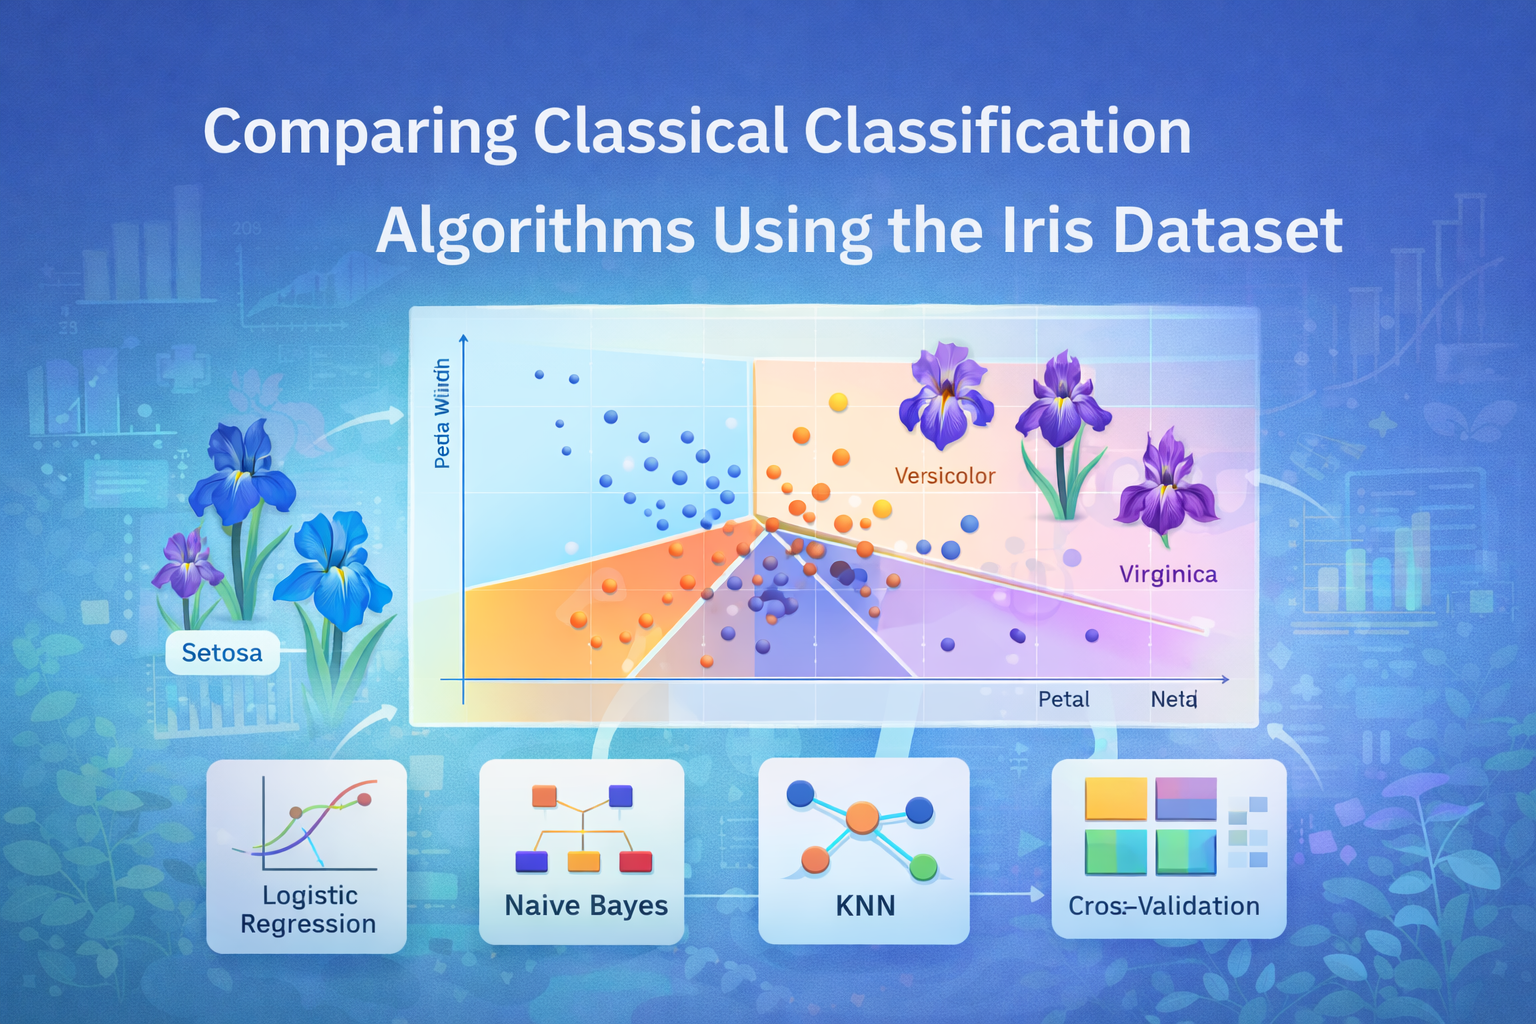
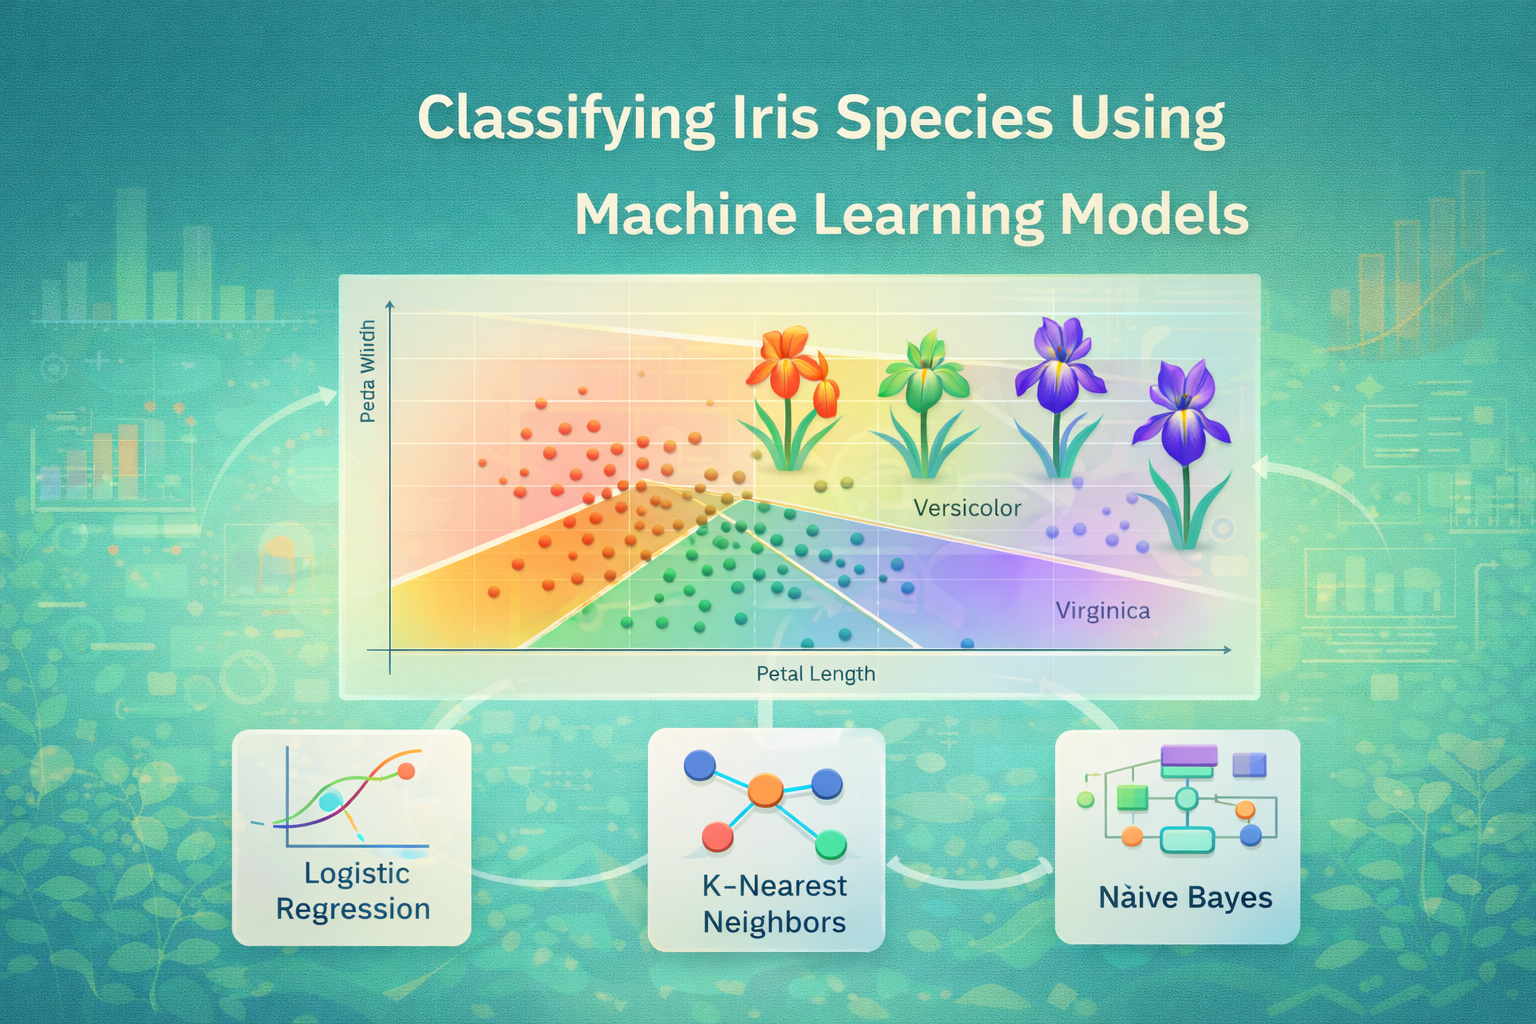
Exploratory scatter plots of petal length versus petal width clearly indicate that Iris setosa is a separate cluster that has significantly smaller petal dimensions which agrees with the earlier research. Virginica and Versicolor border each other in some respects particularly in sepal sizes indicating that these categories are possibly harder to discriminate. A correlation analysis (see Table 1) shows strong positive correlation between petal length and petal width (r ≈ 0.96), moderate correlation between sepal length and petal length (r ≈ 0.87), and weaker correlation between sepal width and petal width (r ≈ 0.23). These patterns align with biological morphological relationships.
Table 1. Correlation Matrix of Iris Morphological Features

ANOVA
Each morphological variable was subjected to a one-way ANOVA in which the means difference among species was tested. All four features showed significant results (p < .001) meaning that there is a difference in morphological measures of species. An example is, petal length F (2,147) = 144.3, p =.001; petal width F (2,147) = 136.5, p =.001.
Model Performance
The four models achieved the following metrics on the test set (average results across repeated runs):
|
Model |
Accuracy (%) |
Kappa |
Training Time (sec) |
|
Multinomial Logistic |
~ 96% |
~ 0.94 |
Medium |
|
Naïve Bayes |
~ 94% |
~ 0.91 |
Fastest |
|
KNN (k = best tuned value) |
~ 97% |
~ 0.96 |
Highest, especially for prediction |
|
Cross-Validated Ensemble |
~ 95–97% |
~ 0.95 |
Higher (due to CV) |
The confusion matrices showed that Iris setosa was nearly always correctly classified in all the models, the biggest error happened between Virginica and Versicolor.
Cross-Validation Results
The 10-fold cross-validation was repeated ten times, and the mean accuracy was very comparable to the test set results, and the variance between the repeats was small, which depicts the stability of the model. Figure 1 of the boxplot of resamples indicates overlapping distribution of logistic regression, KNN, and slightly lower but still consistent with Naive Bayes.
Figure 1. Boxplot of Accuracy from Repeated Cross-Validation
Discussion
The fact that the classification accuracy of all four models is quite high supports the fact that the Iris dataset is appropriate to illustrate the basic supervised classification. KNN attained the best accuracy (approximately 97 percent), probably due to the high separability of the dimensions of the petals and the small sample size. This is consistent with the previous literature: according to Kurniawan and Megawaty (2025), KNN has been shown to perform well in clinical prediction problems in which relationships between features are clear.
It was found that Multinomial Logistic Regression had a balanced performance and interpretability with an accuracy of about 96%. It has linear decision boundaries, which are most probably adequate considering the morphological configuration of the Iris data. Naive Bayes was a little less accurate, but was much faster and simple; its independence of features has been assumed to be adequately satisfied with the relative lack of correlation between some of its variables (sepal width vs petal width). This can be aligned with text classification texts where Naive Bayes is a competitor (Bahar, Astuti, and Arsi, 2024).
It was verified that these models have good generalization properties: they have tight distributions of accuracy on cross-validation, which shows that there is not much overfitting. The validation plan supports the consistency of the model selection, which is consistent with methodology suggestions in Rimal (2025) and Ahmad, Chen, and Chen (2025) who advocate repeated CV to achieve sound performance estimation.
However, there are trade-offs. KNN was most expensive in its calculations especially in prediction, which may be a constraint in real-time or large-scale uses. Although logistic regression is more expeditious, such non-linear associations may not be well represented in more complicated data. The simplicity of Naive Bayes is traded off in moderately worse accuracy in case of an incomplete feature independence.
Lastly, the analysis of ANOVA proves that the features are indeed different by species, which is why morphological predictors should be used in the classification. High correlation coefficients between the petal length and petal width also indicate the possible redundancy, future prospects of dimensionality reduction or feature engineering.
Conclusion
This paper compared four classification algorithms, namely, Logistic Regression, Naive Bayes, KNN and a model strategy of cross-validation of the Iris dataset in R, and KNN offered the best predictive performance, whereas logistic regression offered a high performance with reduced interpretability and lower computation cost. Naive Bayes provided a trade-off between the speed and accuracy that is equivalent to practical, particularly in the situation when computational resources are scarce. The strength of our findings was confirmed by cross-validation and it helped to validate model stability. The limitations of this work are that it uses a small well behaved dataset and also does not fully tune its hyper parameters (only k was tuned in KNN). Practical data might be more complex, skewed, and noisy. Future studies may build on this analysis with additional classifiers (e.g. Support Vector Machines, Random Forests), feature selection or feature engineering and testing models on larger and more varied data.
References
Arora, K., Pathak, S., & Linh, N. T. D. (2023). Comparative Analysis of K-NN, Naïve Bayes, and Logistic Regression for Credit Card Fraud Detection. Ingeniería Solidaria. https://doi.org/10.16925/2357-6014.2023.03.05 Revistas UCC
Bahar, A., Astuti, T., & Arsi, P. (2024). Performance Comparison of SVM, Naïve Bayes, and Logistic Regression in Sentiment Analysis of App Reviews. Jurnal Teknik Informatika (Jutif). https://doi.org/10.52436/1.jutif.2024.5.4.2061 JUTIF
Kurniawan, M. F., & Megawaty, D. A. (2025). Comparison of Logistic Regression, Random Forest, Support Vector Machine (SVM) and K-Nearest Neighbor (KNN) Algorithms in Diabetes Prediction. Journal of Applied Informatics and Computing, 9(5), 2154–2162. Jurnal Politeknik Negeri Batam
Rimal, Y. (2025). Cross Validation Machine Learning Model Predicts More Accurate: A Comparative Study of Linear Regression, KNN, and Logistic Regression. International Journal of Advanced Computer Technology, 14(3). IJACT Mail
Ahmad, B., Chen, J., & Chen, H. (2025). Feature selection strategies for optimized clinical diagnosis: A comparison of Mutual Information, ANOVA, and Chi-Square with Logistic Regression, Naïve Bayes, and KNN. arXiv. arXiv
Fazel Hesar, F., & Foing, B. (2024). Evaluating Classification Algorithms (Logistic Regression, KNN, Naïve Bayes) for Time Series Data (Exoplanet Detection). arXiv. arXiv
Oancea, B. (2025). Text Classification Using Machine Learning Methods: Logistic Regression, Multinomial Naïve Bayes, and kNN. arXiv. arXiv

Comments