Regression analysis is one of the most powerful and widely used statistical tools in quantitative research. Whether in business, economics, psychology, education, or health sciences, students frequently rely on regression models to examine relationships between variables. However, running a regression in SPSS, Stata, R, or Excel is only the first step. The real challenge lies in interpretation. This regression analysis interpretation guide provides a structured and academically sound explanation of how to read, understand, and report regression outputs correctly.
Many students struggle with interpreting coefficients, understanding R-squared, distinguishing between statistical and practical significance, and explaining regression assumptions. Misinterpretation can weaken an entire dissertation. This guide walks through regression interpretation step by step, ensuring clarity, accuracy, and methodological credibility.
What Is Regression Analysis?
Regression analysis is a statistical method used to examine the relationship between one dependent variable and one or more independent variables. Its primary purpose is to estimate how changes in predictor variables influence an outcome variable. Regression allows researchers not only to test relationships but also to make predictions.
Regression analysis estimates how much the dependent variable changes when an independent variable increases by one unit.
For example, a researcher might examine how study hours (independent variable) influence exam scores (dependent variable). The regression model estimates the size and direction of that relationship while controlling for other variables if necessary.
Types of Regression Models
Understanding the type of regression model being used is essential before interpreting results. Different models serve different purposes.
| Model Type | Dependent Variable Type | Example Use |
|---|---|---|
| Simple Linear Regression | Continuous | Study hours → exam score |
| Multiple Regression | Continuous | Study hours + attendance → exam score |
| Logistic Regression | Binary | Pass vs fail prediction |
| Polynomial Regression | Continuous | Curved relationships |
Interpretation varies slightly depending on the model type, but the fundamental principles remain consistent.
Interpreting Regression Coefficients
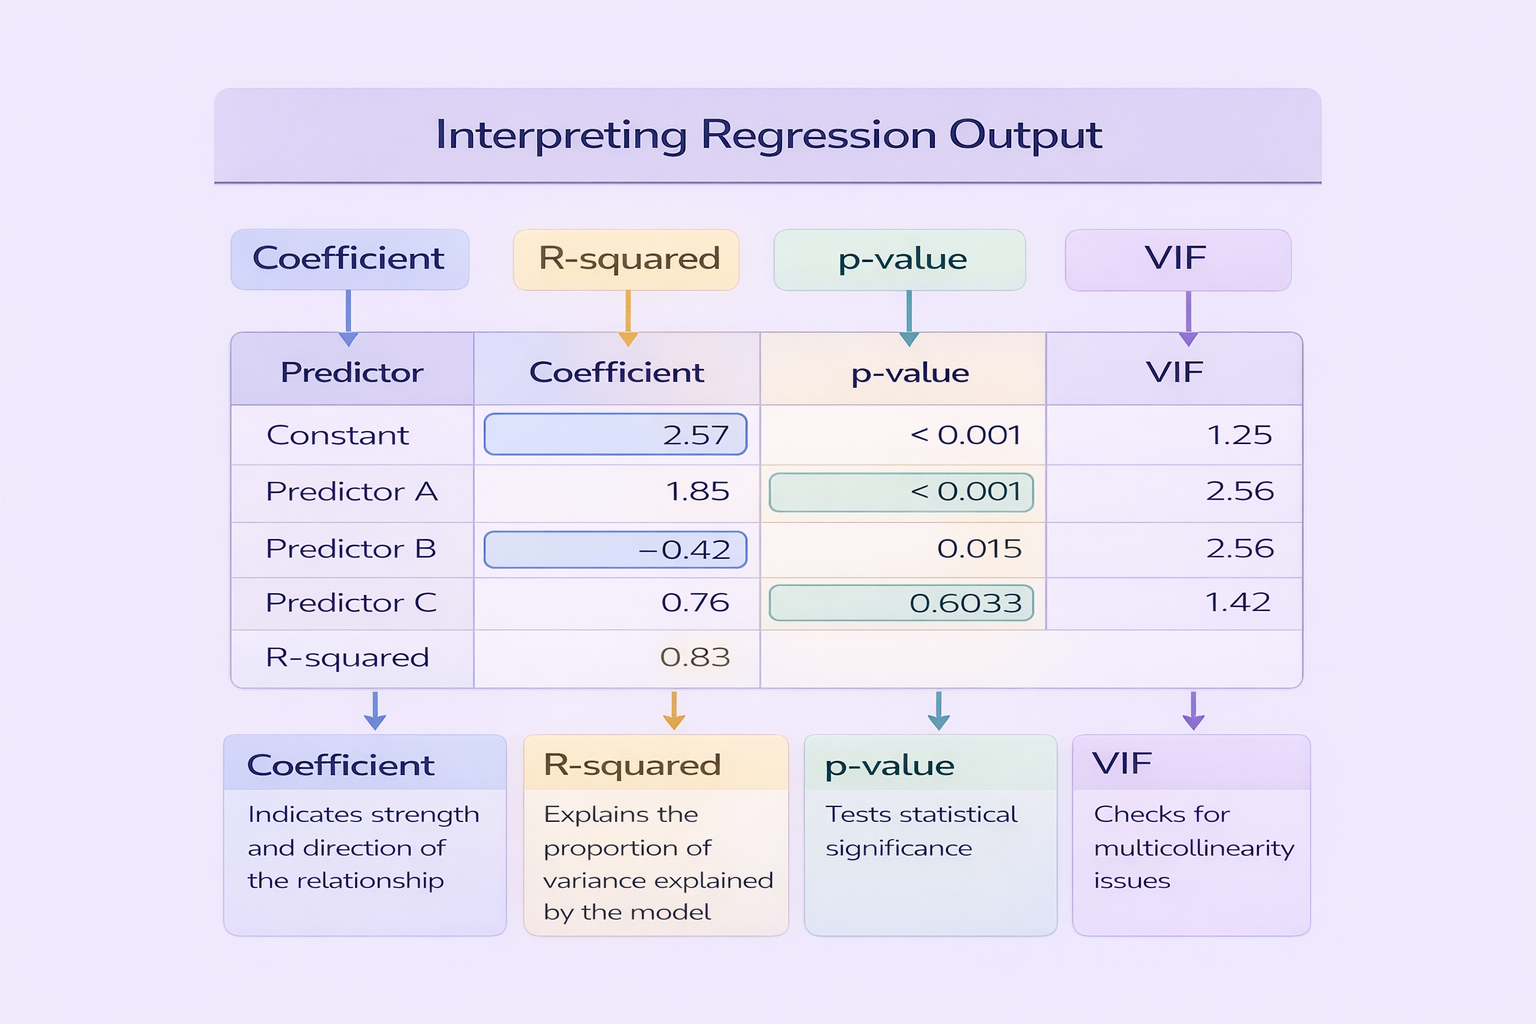
The regression coefficient (often labelled B or β) represents the estimated change in the dependent variable for a one-unit increase in the independent variable, holding other variables constant.
For example, if the coefficient for study hours is 2.5, this means that for every additional hour of study, exam scores increase by 2.5 points on average, assuming other variables remain constant.
A statistically significant coefficient does not automatically imply a strong or practically important effect.
Students must interpret both the direction (positive or negative) and magnitude of coefficients, not just their significance.
Understanding R-Squared and Model Fit
R-squared (R²) measures the proportion of variance in the dependent variable explained by the independent variables. It ranges from 0 to 1. A higher R² indicates better explanatory power, but interpretation depends on discipline and research context.
| R² Value | Interpretation |
|---|---|
| 0.10 | Explains 10% of variance (low explanatory power) |
| 0.30 | Explains 30% of variance (moderate) |
| 0.50+ | Explains 50%+ of variance (strong in many social sciences) |
Adjusted R-squared is often preferred in multiple regression because it accounts for the number of predictors included in the model.
Interpreting P-Values and Statistical Significance
The p-value indicates whether a regression coefficient is statistically significant. A common threshold is p < 0.05. If the p-value is below this threshold, the relationship is considered statistically significant.
However, statistical significance does not equal practical importance. A small coefficient may be statistically significant in large samples but have minimal real-world impact.
Confidence Intervals in Regression
Confidence intervals provide a range of values within which the true population coefficient likely falls. Narrow intervals indicate precise estimates, while wide intervals suggest greater uncertainty.
When reporting regression results, including confidence intervals strengthens interpretation and demonstrates methodological awareness.
Regression Assumptions
Regression analysis relies on key assumptions. Violating these assumptions may invalidate results.
- Linearity between predictors and outcome
- Independence of errors
- Homoscedasticity (equal variance of residuals)
- Normal distribution of residuals
- No multicollinearity (for multiple regression)
Students should test and report these assumptions in their methodology sections. Ignoring them is a common academic weakness.
Multicollinearity and VIF Interpretation
In multiple regression, multicollinearity occurs when independent variables are highly correlated with each other. This can distort coefficient estimates. Variance Inflation Factor (VIF) is used to detect multicollinearity.
| VIF Value | Interpretation |
|---|---|
| 1 | No multicollinearity |
| 1–5 | Moderate but acceptable |
| > 5 | Potential problem |
Addressing multicollinearity ensures stable and interpretable regression estimates.
Reporting Regression Results in Dissertations
Clear reporting is essential for academic credibility. A standard reporting format for multiple regression might include the model fit statistics, F-value, R², coefficients, standard errors, p-values, and effect sizes.
An example:
Multiple regression analysis revealed that study hours significantly predicted exam performance, B = 2.45, SE = 0.65, p = .001. The overall model was significant, F(3, 96) = 8.32, p < .001, explaining 28% of the variance in exam scores (R² = .28).
This format ensures clarity and transparency in academic writing.
Common Mistakes in Regression Interpretation
Students frequently make avoidable errors when interpreting regression output:
- Confusing correlation with causation
- Ignoring model assumptions
- Reporting p-values without coefficients
- Failing to interpret the direction of relationships
- Overstating predictive power
Avoiding these mistakes strengthens methodological rigour and improves overall research quality.
Mastering Regression Analysis Interpretation for Academic Success
This regression analysis interpretation guide demonstrates that reading regression output requires more than identifying significant p-values. Students must interpret coefficients, evaluate model fit, test assumptions, and present findings transparently.
By understanding how each component of regression output contributes to overall interpretation, students can produce analytically sound and academically credible research. Mastery of regression analysis not only strengthens dissertations but also develops essential data analysis skills for professional and research careers.
Comments