In quantitative research, choosing the correct statistical test is critical for producing valid and credible findings. One of the most common areas of confusion for students is understanding the difference between a t-test and ANOVA. When comparing group means, researchers frequently ask: Should I use a t-test or ANOVA? Are they fundamentally different? Can ANOVA replace a t-test? This t test vs ANOVA explained guide clarifies these questions in a structured and academically rigorous way.
Both t-tests and Analysis of Variance (ANOVA) are inferential statistical tests used to compare means. However, they differ in the number of groups they compare, the complexity of design, and the interpretation of results. Understanding these distinctions ensures appropriate test selection and strengthens the methodological section of dissertations and research projects.
What Is a T-Test?
A t-test is a statistical test used to compare the means of two groups to determine whether they are significantly different from each other. It is based on the t-distribution and evaluates whether observed differences between group means are likely due to random variation or represent true differences in the population.
A t-test compares the means of two groups to determine whether the difference is statistically significant.
For example, a researcher might use a t-test to compare exam scores between male and female students, or between a control group and an experimental group. The test produces a t-value and a p-value, which together determine statistical significance.
Types of T-Tests
There are three main types of t-tests, each suited to different research designs.
| Type | When to Use | Example Scenario |
|---|---|---|
| Independent Samples T-Test | Compare two separate groups | Male vs female exam scores |
| Paired Samples T-Test | Compare the same group at two time points | Pre-test vs post-test scores |
| One-Sample T-Test | Compare sample mean to known population mean | Class average vs national average |
Each version serves a specific purpose, and choosing the correct type ensures accurate statistical conclusions.
What Is ANOVA?
ANOVA, or Analysis of Variance, is a statistical test used to compare the means of three or more groups. While it can technically compare two groups, it is primarily designed for multi-group comparisons. ANOVA determines whether at least one group mean differs significantly from the others.
ANOVA compares three or more group means to detect overall differences.
For example, a researcher studying teaching methods might compare exam scores across three instructional strategies. Rather than conducting multiple t-tests, which increases the risk of Type I error, ANOVA provides a single overall test.
Types of ANOVA
ANOVA can take different forms depending on the research design.
| Type | Purpose | Design Example |
|---|---|---|
| One-Way ANOVA | Compare one independent variable with 3+ groups | Three teaching methods |
| Two-Way ANOVA | Examine two independent variables | Teaching method × gender |
| Repeated Measures ANOVA | Same participants across 3+ time points | Pre-test, mid-test, post-test |
More complex versions, such as factorial ANOVA, allow researchers to examine interaction effects between variables.
T-Test vs ANOVA Explained: Key Differences
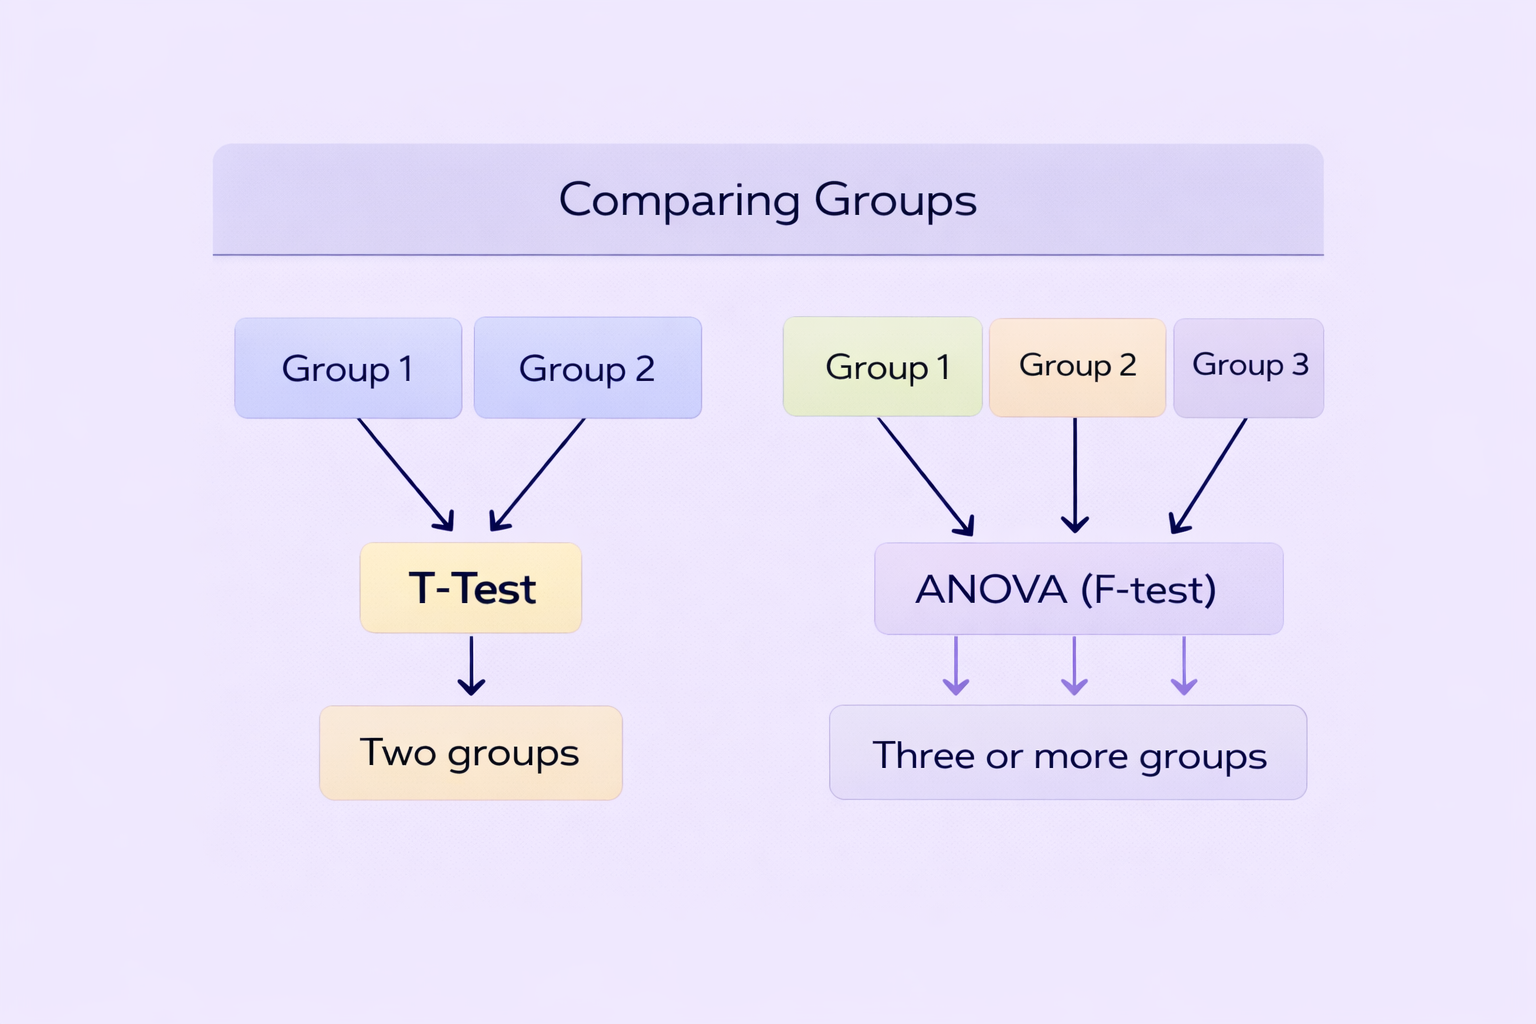
The primary difference between a t-test and ANOVA lies in the number of groups being compared. A t-test compares two groups, while ANOVA compares three or more. However, both tests examine differences between means using similar statistical logic.
| Feature | T-Test | ANOVA |
|---|---|---|
| Number of Groups | Two | Three or more |
| Test Statistic | t-value | F-value |
| Complex Designs | Limited | Supports multiple variables |
| Error Control | Higher risk with multiple tests | Controls Type I error |
Conducting multiple t-tests instead of ANOVA increases the probability of falsely identifying significant differences. ANOVA mitigates this by performing a single overall test.
Statistical Assumptions for Both Tests
Both t-tests and ANOVA rely on similar assumptions. Violating these assumptions can compromise validity.
- Normal distribution of data within groups
- Homogeneity of variance
- Independence of observations
If assumptions are violated, alternative tests such as non-parametric equivalents (e.g., Mann–Whitney U test or Kruskal–Wallis test) may be appropriate.
Interpreting Results: P-Values and Effect Sizes
Both tests produce a p-value indicating whether differences are statistically significant. However, statistical significance alone does not indicate practical importance. Researchers should also report effect sizes, such as Cohen’s d for t-tests or eta squared for ANOVA.
Reporting only p-values without effect sizes weakens academic credibility.
In ANOVA, if the overall F-test is significant, post-hoc tests (such as Tukey’s HSD) are required to identify which specific groups differ.
When Should You Use a T-Test Instead of ANOVA?
A t-test should be used when comparing exactly two groups. If your research question involves only two conditions, using ANOVA is unnecessary, although technically permissible.
However, when there are three or more groups, ANOVA is the correct choice to prevent inflation of Type I error and to allow systematic comparison.
Reporting T-Test and ANOVA Results in Dissertations
Proper reporting is essential in academic writing. For a t-test, students should report the t-value, degrees of freedom, p-value, and effect size. For ANOVA, report the F-value, degrees of freedom, p-value, and effect size, followed by post-hoc results if applicable.
An example for ANOVA might be:
A one-way ANOVA revealed a significant difference in test scores across teaching methods, F(2, 87) = 4.35, p = .016, η² = .09.
Clear reporting demonstrates statistical competence and strengthens methodological transparency.
Mastering T-Test vs ANOVA for Quantitative Research Success
This t test vs ANOVA explained guide highlights that both tests serve similar purposes but differ in application scope. A t-test is ideal for comparing two groups, while ANOVA handles three or more groups and complex designs. Both require attention to assumptions, effect sizes, and proper reporting.
By selecting the appropriate test and presenting results clearly, students enhance the quality and credibility of their quantitative research. Mastery of these statistical tools not only strengthens dissertations but also builds essential analytical skills for academic and professional research environments.
Comments