Statistics and probability form the backbone of data-driven academic research. Across disciplines such as economics, health sciences, psychology, education, and business, students are expected not only to present numerical results but also to explain what those numbers mean and how they support reliable conclusions. Misunderstanding this process often leads to weak analysis, incorrect interpretations, and poorly justified claims.
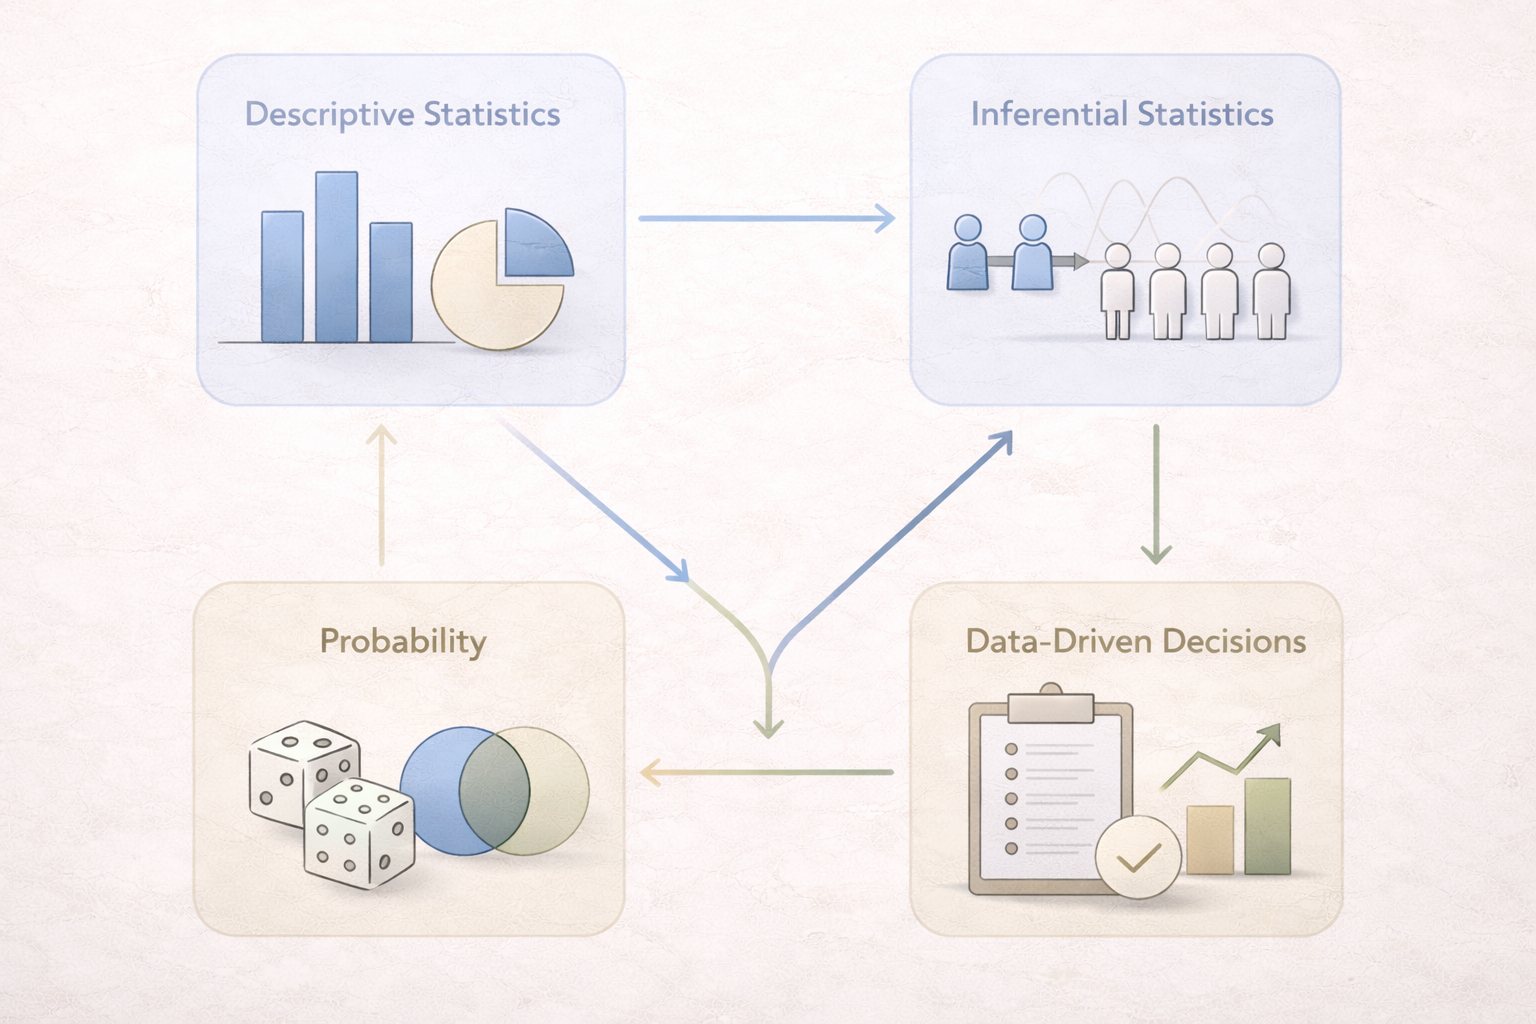
The image presented illustrates the full analytical journey, beginning with descriptive statistics, moving through inferential statistics and probability theory, and ending with practical applications such as testing, forecasting, and decision-making. This structure reflects how data analysis is taught, examined, and applied at university level.
This article explains each stage of that journey in detail, helping students understand how statistical tools connect logically rather than appearing as isolated techniques.

What Statistics and Probability Aim to Achieve
At its core, statistics is the discipline of learning from data. It provides tools for organising information, identifying patterns, and drawing conclusions that extend beyond individual observations. Probability complements this process by quantifying uncertainty and expressing how likely events are to occur.
In academic work, these two areas are inseparable. Statistics summarises and analyses data, while probability explains the reliability of those analyses. Together, they allow researchers to move from raw numbers to defensible insights.
Statistics describes what the data show; probability explains how confident we can be in those findings.
Understanding this relationship helps students avoid treating formulas as mechanical steps and instead use them as reasoning tools.
Descriptive Statistics: Summarising and Describing Data
Descriptive statistics represent the first stage of analysis. Their purpose is to condense large datasets into manageable summaries that highlight central tendencies, variability, and overall structure. Common measures include the mean, median, mode, range, and standard deviation.
For example, calculating an average score or displaying results in a chart allows readers to grasp patterns quickly without inspecting every individual data point. In academic assignments, descriptive statistics are often required before any interpretation or hypothesis testing begins.
| Measure | What It Describes | Academic Use |
|---|---|---|
| Mean | Average value | Overall performance or level |
| Median | Middle value | Skewed distributions |
| Standard deviation | Spread of data | Variability and consistency |
Clear descriptive statistics strengthen academic writing by grounding arguments in observable data patterns.
Inferential Statistics: Making Predictions About Populations
Inferential statistics extend analysis beyond the data collected. Instead of describing a sample alone, they allow researchers to make informed statements about a wider population. This is essential because studying entire populations is often impractical or impossible.
Through techniques such as confidence intervals and hypothesis testing, inferential statistics estimate population parameters while acknowledging uncertainty. This step transforms data from descriptive evidence into analytical reasoning.
Inferential statistics allow researchers to generalise responsibly, not speculate freely.
Students frequently lose marks by reporting inferential results without explaining what they imply for the population being studied. Interpretation is as important as calculation.
Understanding Probability in Academic Analysis
Probability quantifies the likelihood of events and outcomes. In research, it underpins inferential methods by expressing how unusual or expected a result is under specific assumptions.
The image highlights three core probability concepts that regularly appear in exams and research reports: independent events, dependent events, and mutually exclusive events. Understanding these distinctions is critical for correct analysis.
Independent Events
Independent events are events where the occurrence of one does not affect the probability of the other. In academic contexts, this assumption is often required for certain statistical tests to be valid.
For example, the result of one coin toss does not influence the result of another. Misidentifying independence can invalidate an entire analysis.
Dependent Events
Dependent events occur when the outcome of one event affects the likelihood of another. Many real-world datasets involve dependence, especially in longitudinal or repeated-measures studies.
Recognising dependence helps students choose appropriate analytical techniques and avoid incorrect probability calculations.
Mutually Exclusive Events
Mutually exclusive events cannot occur at the same time. In probability theory, this property affects how probabilities are combined and interpreted.
Confusing mutually exclusive events with independent events is a common academic error that leads to incorrect reasoning.
From Analysis to Insight: Building Data-Driven Conclusions
The final stage shown in the image emphasises application. Statistics and probability are not ends in themselves; they support decision-making, prediction, and evaluation.
Techniques such as A/B testing, trend forecasting, and analytical decision-making rely on all earlier stages working together. Weak descriptive summaries, flawed probability assumptions, or misinterpreted inference undermine conclusions.
- A/B testing compares alternatives under controlled conditions
- Trend forecasting projects patterns into the future
- Decision-making integrates evidence with uncertainty
Academic excellence requires explaining not only results, but also how those results inform action or understanding.
Common Student Mistakes in Statistics and Probability
Many students struggle because they treat statistics as a set of disconnected tools. This leads to errors such as presenting numbers without explanation, misusing probability rules, or drawing unsupported conclusions.
| Common Mistake | Why It Is a Problem | Improved Approach |
|---|---|---|
| Reporting results without interpretation | Lacks analytical value | Explain meaning and implications |
| Confusing correlation and inference | Leads to invalid conclusions | Justify claims statistically |
| Ignoring probability assumptions | Invalidates tests | State and assess assumptions |
A structured understanding of the full analytical process helps students avoid these pitfalls.
Using Statistics and Probability Effectively in University Work
Strong academic work integrates statistics and probability into a coherent argument. This means explaining why a method was chosen, what the results show, and how uncertainty affects interpretation.
Whether writing a laboratory report, a dissertation chapter, or a research proposal, students should view statistics as a reasoning framework rather than a computational exercise.
High-quality academic analysis connects data, method, and meaning.
Mastering this connection improves clarity, credibility, and assessment outcomes.
Developing Statistical Literacy for Academic Success
Statistical literacy involves more than performing calculations. It requires understanding data structures, evaluating assumptions, and communicating findings clearly. These skills are increasingly essential across all academic disciplines.
By following the progression shown in the image—from description to inference, probability, and application—students can approach data analysis with confidence and methodological integrity.
This structured mindset transforms statistics from a source of confusion into a powerful academic tool.
Comments