In academic writing, data visualisation is a powerful tool that complements the written argument. Tables and figures—ranging from statistical grids to graphs and images—help readers interpret complex information quickly and accurately. However, without correct formatting, visual elements can confuse readers or detract from the quality of an assignment.
For students across psychology, education, business, nursing, and social sciences, the APA Publication Manual, 7th Edition outlines specific conventions for presenting tables and figures. Mastering these rules improves readability and signals academic rigour.
This guide explains how to format tables and figures in APA 7 with clear academic examples and structural guidance designed for university assignments.
Why Tables and Figures Matter in APA Academic Writing
Tables and figures serve different but complementary purposes in academic texts. Tables are best for presenting detailed numerical or textual information in structured rows and columns. Figures—including charts, graphs, maps, and photographs—are ideal for showing patterns, trends, or visual concepts.
APA 7 emphasises that these elements should enhance comprehension, not replace explanation. That means every table and figure must be introduced, interpreted, and integrated into the narrative.
Key academic rule: Never include a table or figure that is not referenced and explained in the text.
General APA 7 Rules for Tables and Figures
Before examining specific examples, it’s important to understand the foundational rules that apply to all tables and figures in APA academic work.
- Place each table or figure close to where it is first mentioned.
- Assign a unique number (e.g., Table 1, Figure 2) in the order of appearance.
- Include a clear title and, if needed, a caption or note.
- Ensure all abbreviations and statistical symbols are defined.
Tables and figures should follow consistent formatting that matches the style of the rest of the document.
How to Format Tables in APA 7
APA tables are designed to be self-contained and efficient. They should be used when presenting data that readers need to compare or interpret directly.
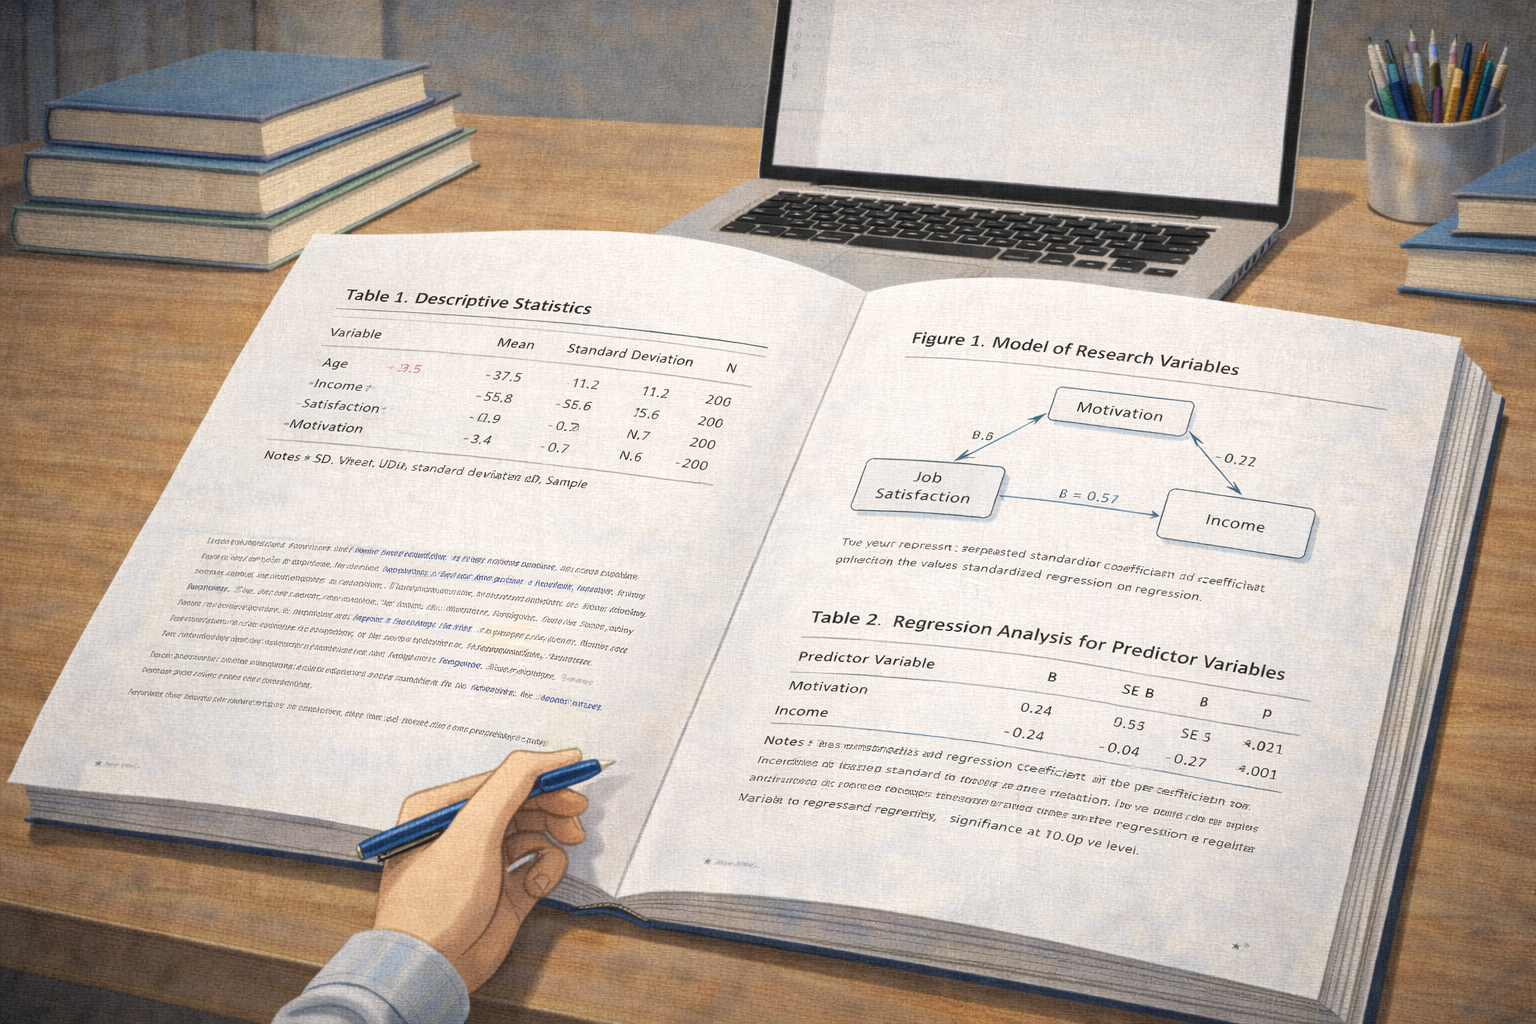
The basic structure of an APA table includes a table number, a title, the table body, and, if needed, table notes.
APA Table Structure Explained
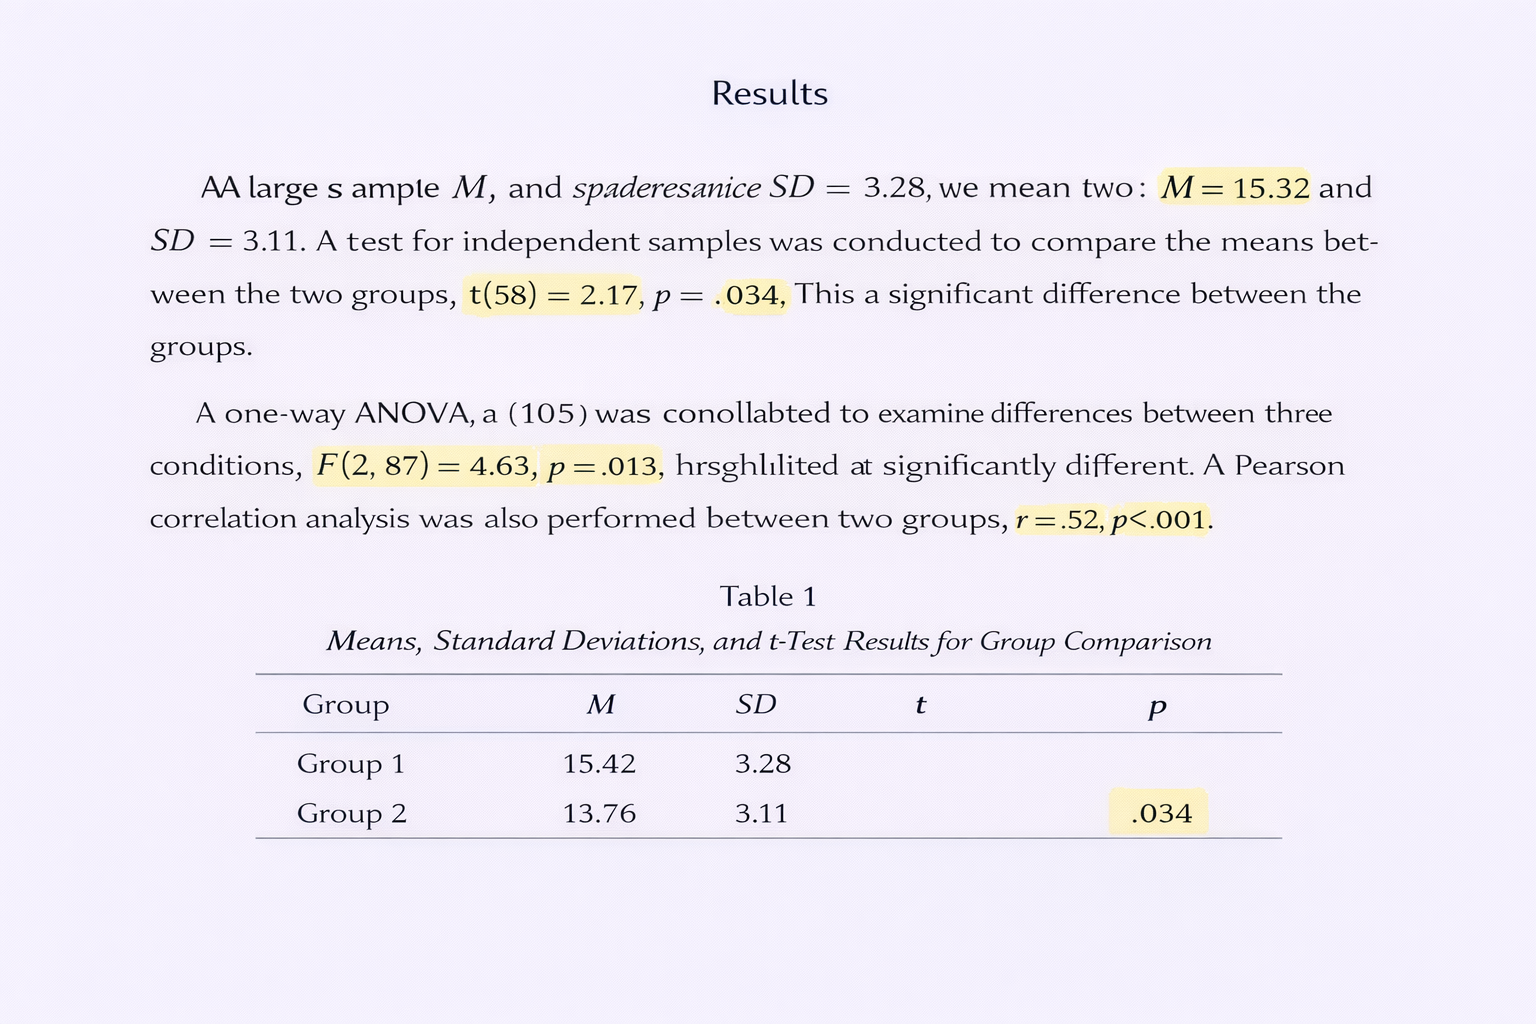
An APA table always begins with a table number (bold), followed by a brief but descriptive title (italicised). The table body includes columns and rows of data. Any notes or clarifications appear beneath the table.
Academic definition: A table in APA must be interpretable without needing the surrounding text, meaning titles and notes should explain context and abbreviations.
Table Example in APA 7
The table below illustrates how APA 7 tables are structured:
| Instructional Method | Mean Score | Standard Deviation |
|---|---|---|
| Traditional Lecture | 78.4 | 5.6 |
| Interactive Workshop | 85.9 | 4.2 |
| Online Module | 82.3 | 3.7 |
Table note (optional): The scores represent the average of two assessment instruments administered post-intervention. Traditional lecture conditions showed lower consistency overall.
This example shows a clear title and neatly aligned data that can be read independently of surrounding paragraphs.
How to Format Figures in APA 7
Figures include charts, graphs, maps, photographs, and illustrations. They are numbered separately from tables and follow similar rules for clarity and interpretation.
Key Components of an APA Figure
An APA figure consists of a figure number, a title (italicised), the visual image itself, and an optional caption or legend. If the figure includes labels or symbols that might be unfamiliar to the reader, include notes directly beneath the figure.
Examiner expectation: A figure must include a clear title and be referenced in the text before it appears.
Unlike tables, figures do not use grid lines unless necessary for interpretation.
Figure Example in APA 7
Below is a visual representation of how an APA figure would be structured:
Figure 1. Line Graph Showing Change in Mean Test Scores Over Three Instructional Weeks
Figure note (optional): Points represent weekly average scores for each instructional group; error bars indicate standard error.
In a real TinyMCE environment, the graph itself would be embedded directly between the title and figure note, ensuring clarity and continuity.
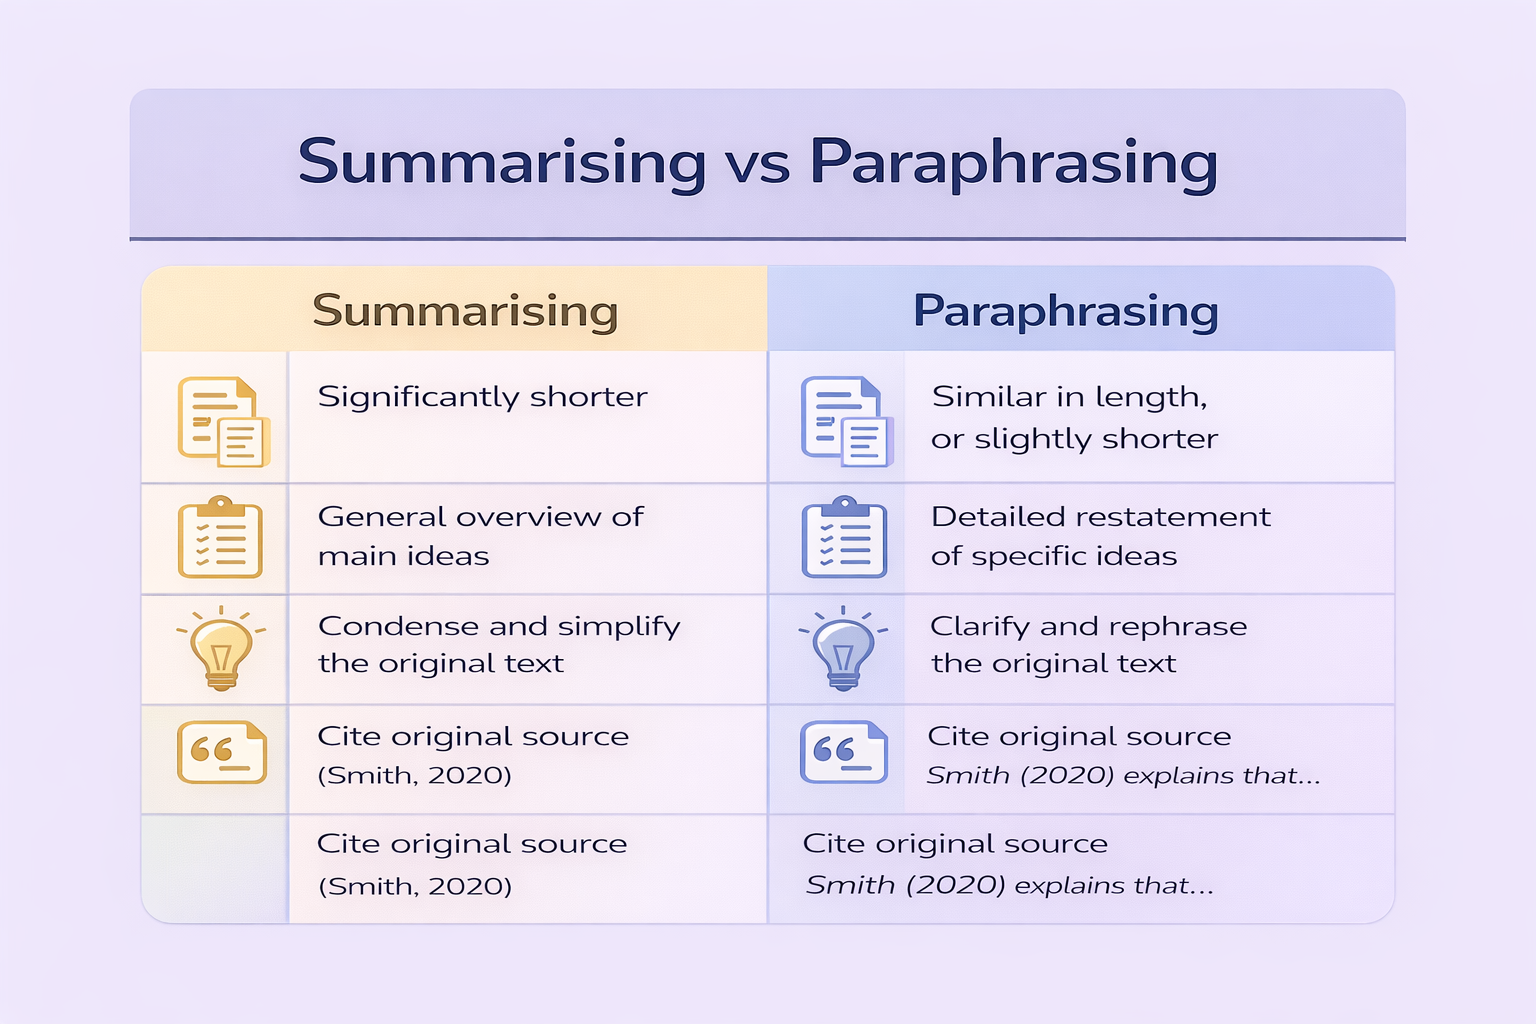
When to Use Tables vs Figures
Knowing when to use a table or a figure is as important as formatting them correctly. Both are tools for data presentation, but they serve different purposes:
- Tables are best for presenting precise numerical values that readers may need to compare directly.
- Figures are ideal for showing trends, patterns, or relationships visually.
For example, if your data show a linear increase in scores over time, a line graph (figure) will communicate the trend more effectively. If the focus is on exact values at specific points, a table is preferable.
Integrating Tables and Figures into the Text
APA 7 emphasises integration: readers should encounter a table or figure only after it has been introduced in the text. This means you must reference it clearly before it appears:
Example narrative reference:
As shown in Table 1, interactive workshops yielded higher mean scores than traditional lectures across all measures.
Similarly with figures:
Example narrative reference:
Figure 1 illustrates the upward trend in average test scores over the three instructional weeks.
Failing to integrate tables and figures into the narrative disrupts the flow and reduces academic coherence.
Notes, Legends, and Abbreviations
When a table or figure includes abbreviations or technical terms, include explanatory notes below the visual element. APA 7 supports three types of notes:
- General notes clarify the entire table or figure.
- Specific notes refer to particular cells or data points, indicated by superscript letters.
- Probability notes explain statistical symbols (e.g., * p < .05).
Correct use of notes ensures that readers can interpret visuals independently of the main text.
Common APA Formatting Mistakes with Tables and Figures
Even experienced writers sometimes make errors with tables and figures. Common pitfalls include:
- Failing to number tables and figures sequentially.
- Not providing clear titles or notes.
- Embedding images without captions or context.
- Positioning the table or figure ahead of its first textual mention.
Markers often deduct points for these issues because they reflect insufficient attention to detail rather than substantive analytical error.
Practical Tips Before Submission
To ensure your tables and figures meet APA 7 expectations:
- Review placement: visuals should be close to their first mention.
- Check numbering and captions for consistency.
- Ensure clarity: labels, legends, and notes should eliminate ambiguity.
- Proofread within TinyMCE Source Code mode to confirm formatting integrity.
Following these steps helps prevent layout or rendering errors during the final submission process.
Confidence with APA Tables and Figures in Academic Writing
Understanding how to format tables and figures in APA is an investment in your academic skill set. These visual elements do more than present data; they communicate analytical precision, support your claims, and demonstrate mastery of scholarly conventions.
By applying the examples and principles in this guide, you can use tables and figures with confidence, enhancing both the clarity and credibility of your university assignments.

Comments